Growing Revenue at a Pumpkin Patch
Applying Growth strategies to a local non-profit and achieving record results
Hi there, it’s Adam. 🤗 Welcome to my weekly newsletter. I started this newsletter to provide a no-bullshit, guided approach to solving some of the hardest problems for people and companies. That includes Growth, Product, company building and parenting while working. Subscribe and never miss an issue. I’ve got a podcast on fatherhood and startups - check out Startup Dad here. Questions? Ask them here.
The Wildwood Dads Club is a registered 501c3 nonprofit. If you were inspired by this newsletter and want to contribute to local schools you can make a donation to the club here. It’s for the kids!
Q: What do you get when you apply a set of growth strategies to a local pumpkin patch?
This week, in honor of Halloween, I wrote about something important to me: fundraising for my kids’ school. But it’s not just a fundraising story; this is also how a group of dads turned a volunteer pumpkin patch into one of the largest fundraising drives of the year. And how we leveraged a whole bunch of growth strategies - across acquisition, retention, monetization, modeling, user psychology and experimentation to make it happen.
And even though today’s newsletter might be a little tongue-in-cheek, it’s chock full of lessons learned on running a “small business.”
Background
The Wildwood Dads Club non-profit organization is a storied institution that dates back ~100 years to the founding of the Wildwood Elementary School. Last year, I was the president of this fine group and this year (as president emeritus) I am a regular volunteer.
The group’s mission is to drive fundraising and community building for Wildwood. School funding is in a precarious position in California and we exist to help close that gap in some small way. Throughout the year we raise ~$15-30k for the school which is then spent on capital improvements, infrastructure projects, and classroom support. Things like playground equipment, classroom technology, and hand sanitizing machines (during peak COVID).
This money is raised through two major community efforts each year: a pumpkin patch in October and a crab feed night out in February.
The pumpkin patch, which runs for most of the month of October, has historically been our largest fundraiser. From 2009 - 2019 the patch generated anywhere from $21.5k to $31.5k in topline revenue (more on costs and net income later). It took a dip during the COVID years and in 2021 came back to ~$30k of revenue. We long believed that was our cap. It seemed unbeatable.
Improving Patch Performance
This newsletter is about 2022 and 2023 and the growth tactics deployed by a handful of wily leaders and an army of volunteers. In 2022 we generated just over $38k in topline revenue which was a 20% improvement YoY and a record-breaking year. This occurred after being stuck at a ceiling of about $31.5k for 13 years (as far back as we have data).
This year, challenged to grow even more and push past our new ceiling, the patch growth and marketing was helmed by Matt Derrigo; our inventory and vendor management were run by Russ Griffith. Through their efforts and the volunteer labor of over 70 dads (and a few moms) the patch generated ~$42,600 in revenue; a 12% YoY increase to set a new record for total patch revenues and single-day sales.
This is the story of how we did it.
There are three phases to the patch: prep, execution and liquidation/cleanup. Each phase is critical to the success of the patch but for very different reasons (I’ll elaborate below). Let’s go through each phase and identify some key lessons.
Phase 1: Prep & Planning
Like any good retailer the preparation phase starts at the end of the previous year’s season. We started both 2022 and 2023 by having a retrospective of the year just completed.
This year we had a lot of improvements we wanted to make from the prior year.
Patch Discoverability (Acquisition)
In the immediate vicinity of the SF Bay Area there are only a handful of pumpkin patches. If you want to drive 45-60+ minutes you’ll find more, but near Oakland, Berkeley, and San Francisco there are only a few. Ours is one of them.
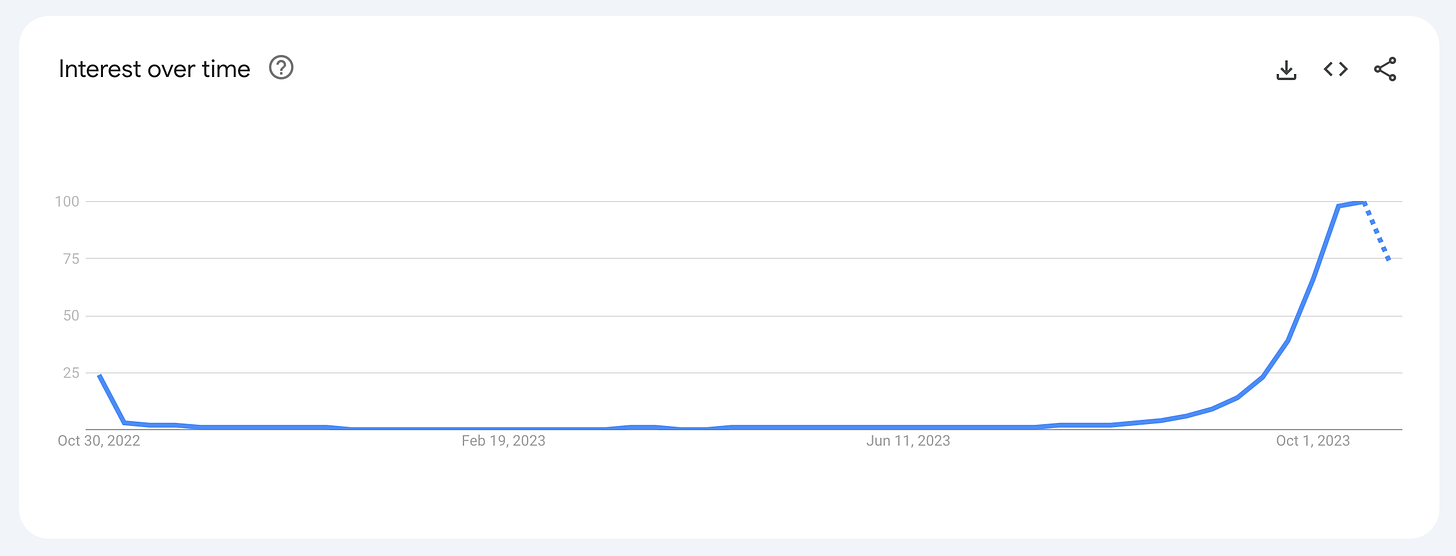
We know that “pumpkin patch” and “patch near me” are big search terms in October. A quick look at Google Trends confirms this.
Here’s “Pumpkin Patch” in Google Trends for the last year:
So yeah, a lot of people search for it. We wanted them to find us.
But like any non-profit where roles and responsibilities are handed down over time we had been previously unable to figure out who owned our Google Maps listing or our Yelp listing. Matt did some expert sleuthing and figured out it was a dad from a decade-plus ago and after a few phone calls and some two-factor authentication he now had the keys to the kingdom… er, patch.
The next step was a local campaign to drum up reviews so we reached out to past purchasers via the club and got a handful of parents to share their love of the patch from prior years. This generated ~6-8 reviews to get us started (more would come) and establish a good foundation.
Also on the topic of acquisition was understanding how people found out about us. Since we’re not a web / eCommerce site we don’t have specific tracking links and instead relied on volunteers asking a “How Did You Hear About Us” survey question. We learned a lot from this during the execution phase (shared below).
Patch Conversion (Monetization)
Online Ordering
During COVID we launched a very necessary order ahead option via our website and we maintained it for 2021 and 2022. It was a decent amount of work but we thought that maybe it contributed to more orders. A quick look in Square confirmed the opposite – in 2022 we sold ~$40 worth of pumpkins via the order ahead option. It was an easy decision to sunset the site and we could then migrate to a new, non-ordering, marketing website.
Purchasing Process
Each year we temporarily activate an old smartphone for ~2 months to handle purchases via Square. For several years we’d been having issues with our Square reader dropping the connection to the phone. This would create all kinds of problems during the checkout process leading to frustrated customers, volunteers and lost sales. Matt was determined to get to the bottom of this for 2023 and solve this problem. He researched connectivity, new service, and even a hardline connection via an ISP. At the end of it all there was an Occam’s Razor solution – the Square app software hadn’t been updated in years because “update via cellular connectivity” was disabled on the phone. Connectivity issues solved!
Margin
One of the biggest killers of patch profitability in prior years (i.e. the amount we are able to give to the school) is cost and margin management. We don’t grow the pumpkins ourselves and instead purchase them through a supplier who we’ve been working with for ~30 years. That means we pay for all of them. Even if we don’t sell them all.
We decided that this year we were going to manage our inventory really tightly to maximize profitability. We also calculated a per varietal cost of goods sold (COGs) since we might pay our supplier by the weight, the unit, or by the crate. If we over-ordered and needed to discount it was important we know just how much margin we had to work with. We sell 25 different items at the patch and each one has a distinct margin profile.
To manage inventory we looked at the units sold on a per-day basis in 2021 and 2022. This gave us a sense of the popularity of each varietal and more importantly when they were most popular. For example, decorative gourds are really popular at the start of October as people buy them for decoration, not carving. As the month progresses carving pumpkins grow (no pun intended) in popularity peaking within the last week before Halloween. But, we offer 4 different sizes of carving pumpkins so it was important to understand which sizes sell best and when.
The other important aspect of our margin was pricing. We can never be as affordable as buying a pumpkin at the grocery store, we just don’t have the scale economies to drive our costs down enough to support that. But, we can be competitive with other pumpkin patches in the area. So this year we did some competitive shopping and priced out other patches within a local driving distance. We knew that we were competitive with other local patches and our purchases supported local K-5 education.
With our prep and planning phase complete it was time for execution.
Phase 2: Execution
The execution phase is the timeframe when the patch is open and running. Driving demand, managing inventory, and addressing customer concerns are key to the success of the patch when it’s open.
To track our sales progress, Matt built a daily growth model with YoY and 2-year ago YoY comparisons. In addition to tracking daily sales, he also added in weather. For an outdoor patch this is very important. We tracked daily high temperatures and precipitation. There isn’t much rain in northern California in October, but heavy rains definitely scare away customers.
Driving Demand
We experimented with a lot of different demand generation strategies this year. Here are a list of our channels and experiments:
Local signage - wooden pumpkin signs at key intersections. This was not a new channel but we made some improvements.
Google - as mentioned above, we improved our presence in google maps and local search. New photos, reviews, hours, etc.
Yelp - we attempted some Yelp advertising; this was unsuccessful.
Facebook / Instagram - we attempted some Facebook advertising as well as local Facebook group postings. The advertising was minimally successful but the local postings worked better.
Coloring Sheets for School - previously we had done coloring sheets for kids to take home promoting the patch. When they brought them to the patch (with their parents in tow) they’d get a piece of candy. This year we re-introduced them and offered a free mini-pumpkin. They worked very well as you’ll see below.
Local Newspaper - we paid for a 4-week rotating ad in the local newspaper and had regular mentions in print talking about the history of the patch with photos of families.
So what worked? Given that our costs for each of these are relatively low (or free) most of them worked to some extent.
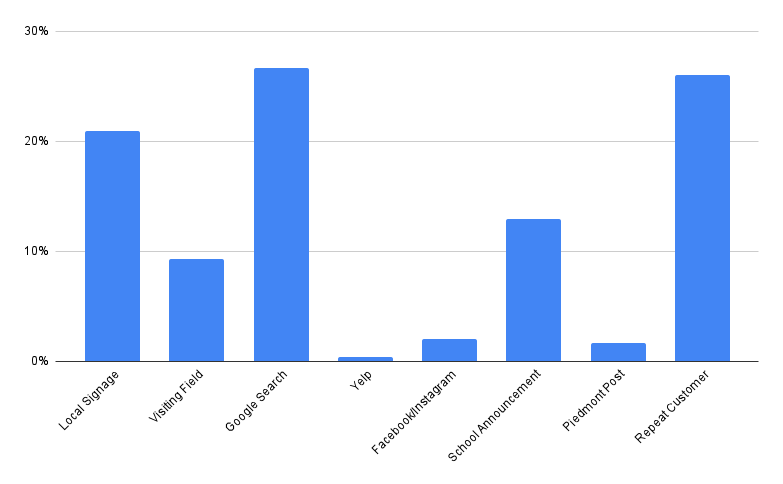
Here is what really worked:
Local signage, Organic Google Search, and the School Coloring Sheets/Announcements drove 60% of our tracked demand. Excluding Repeat Customers it was 82%.
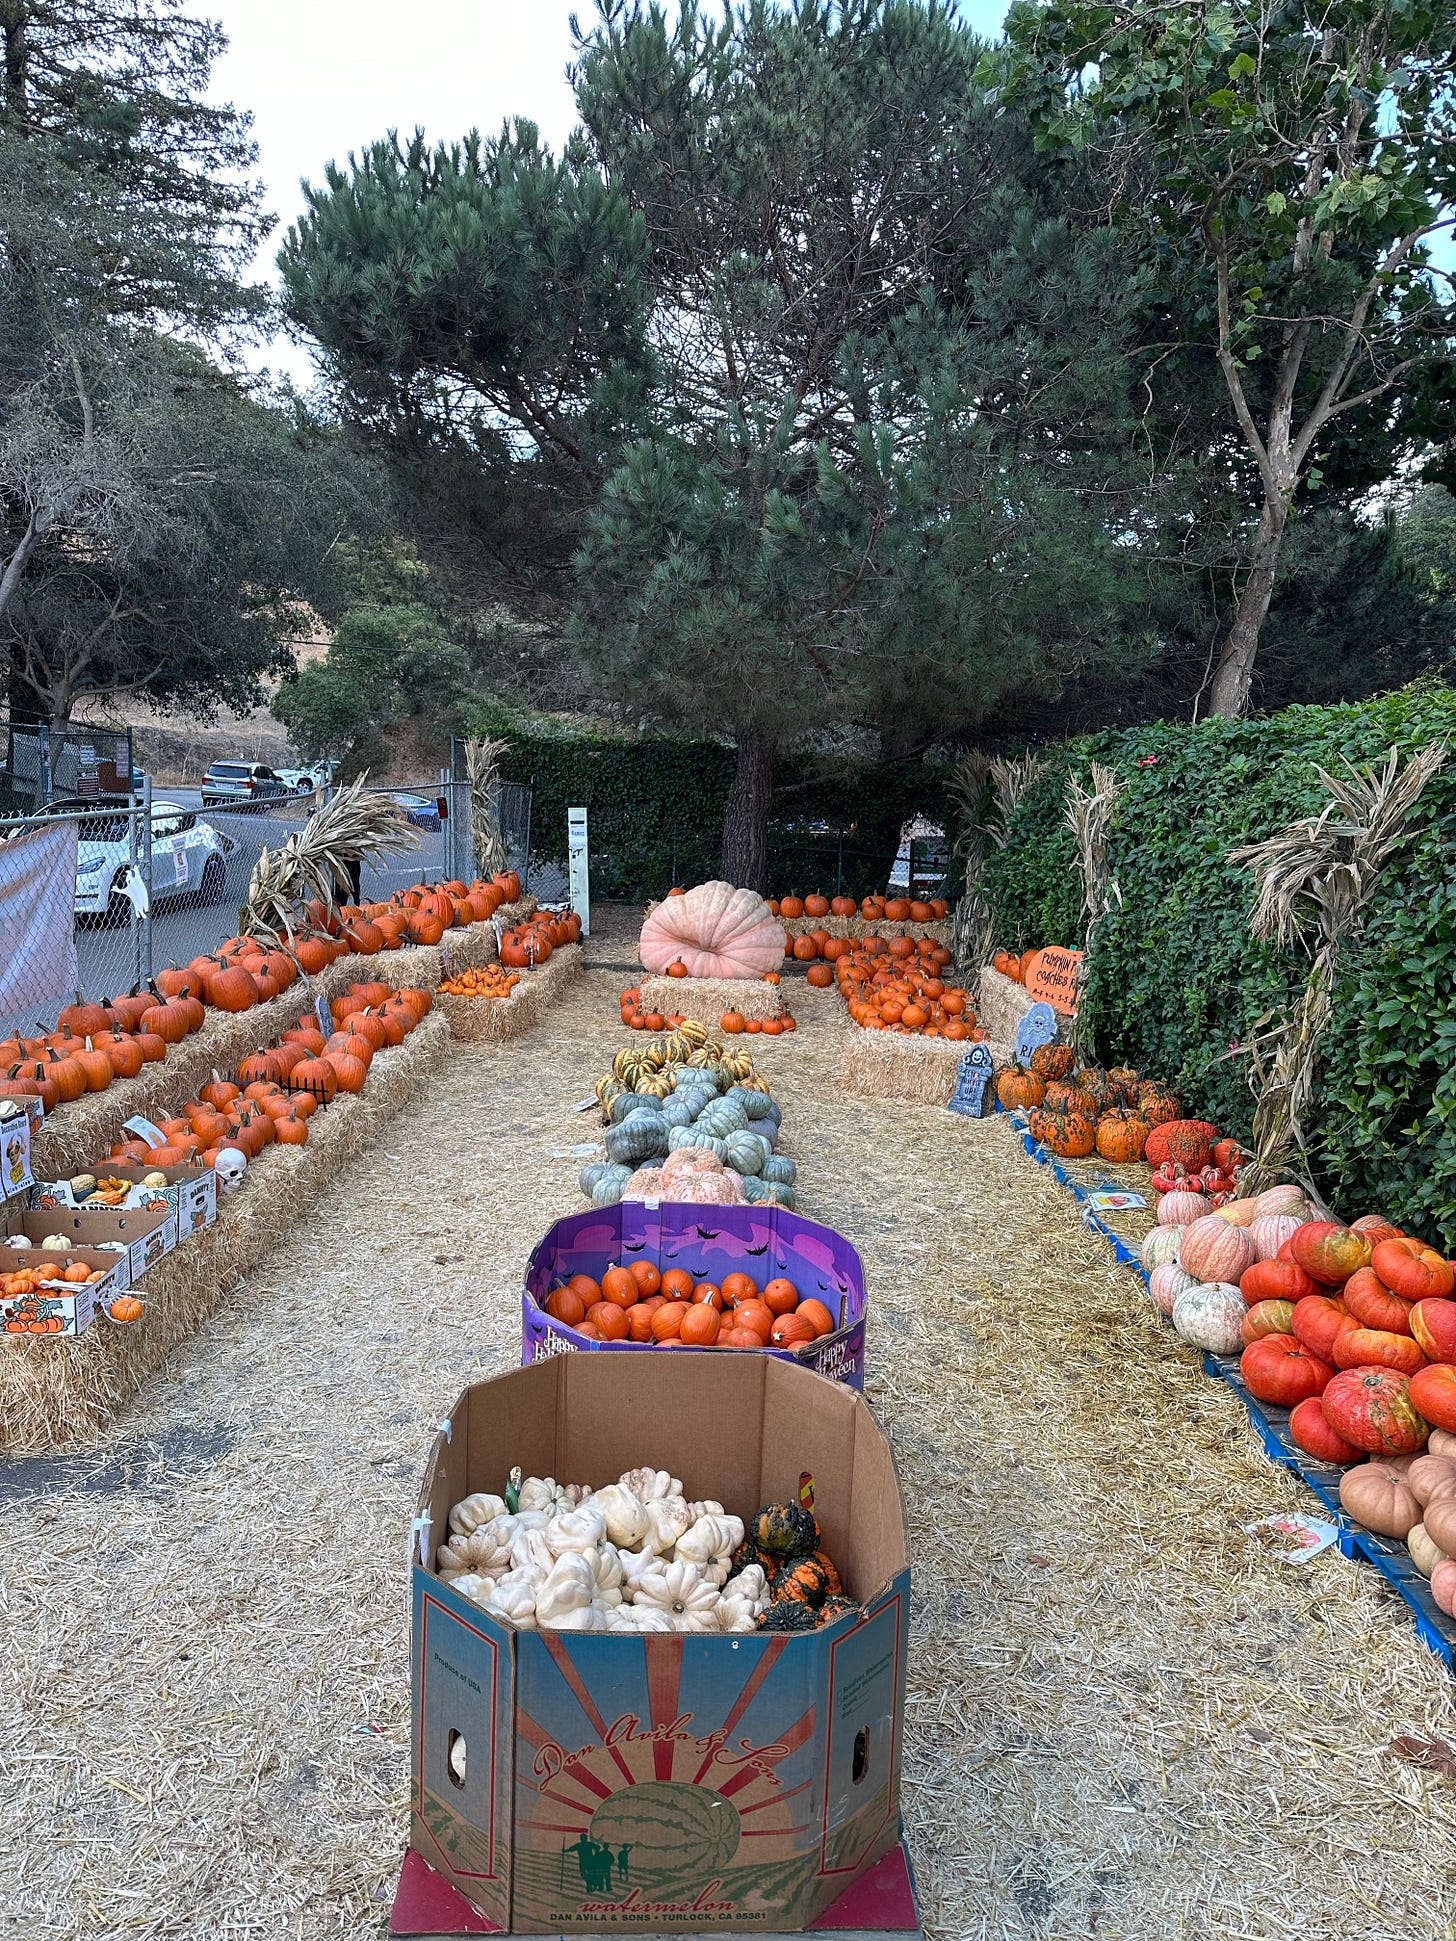
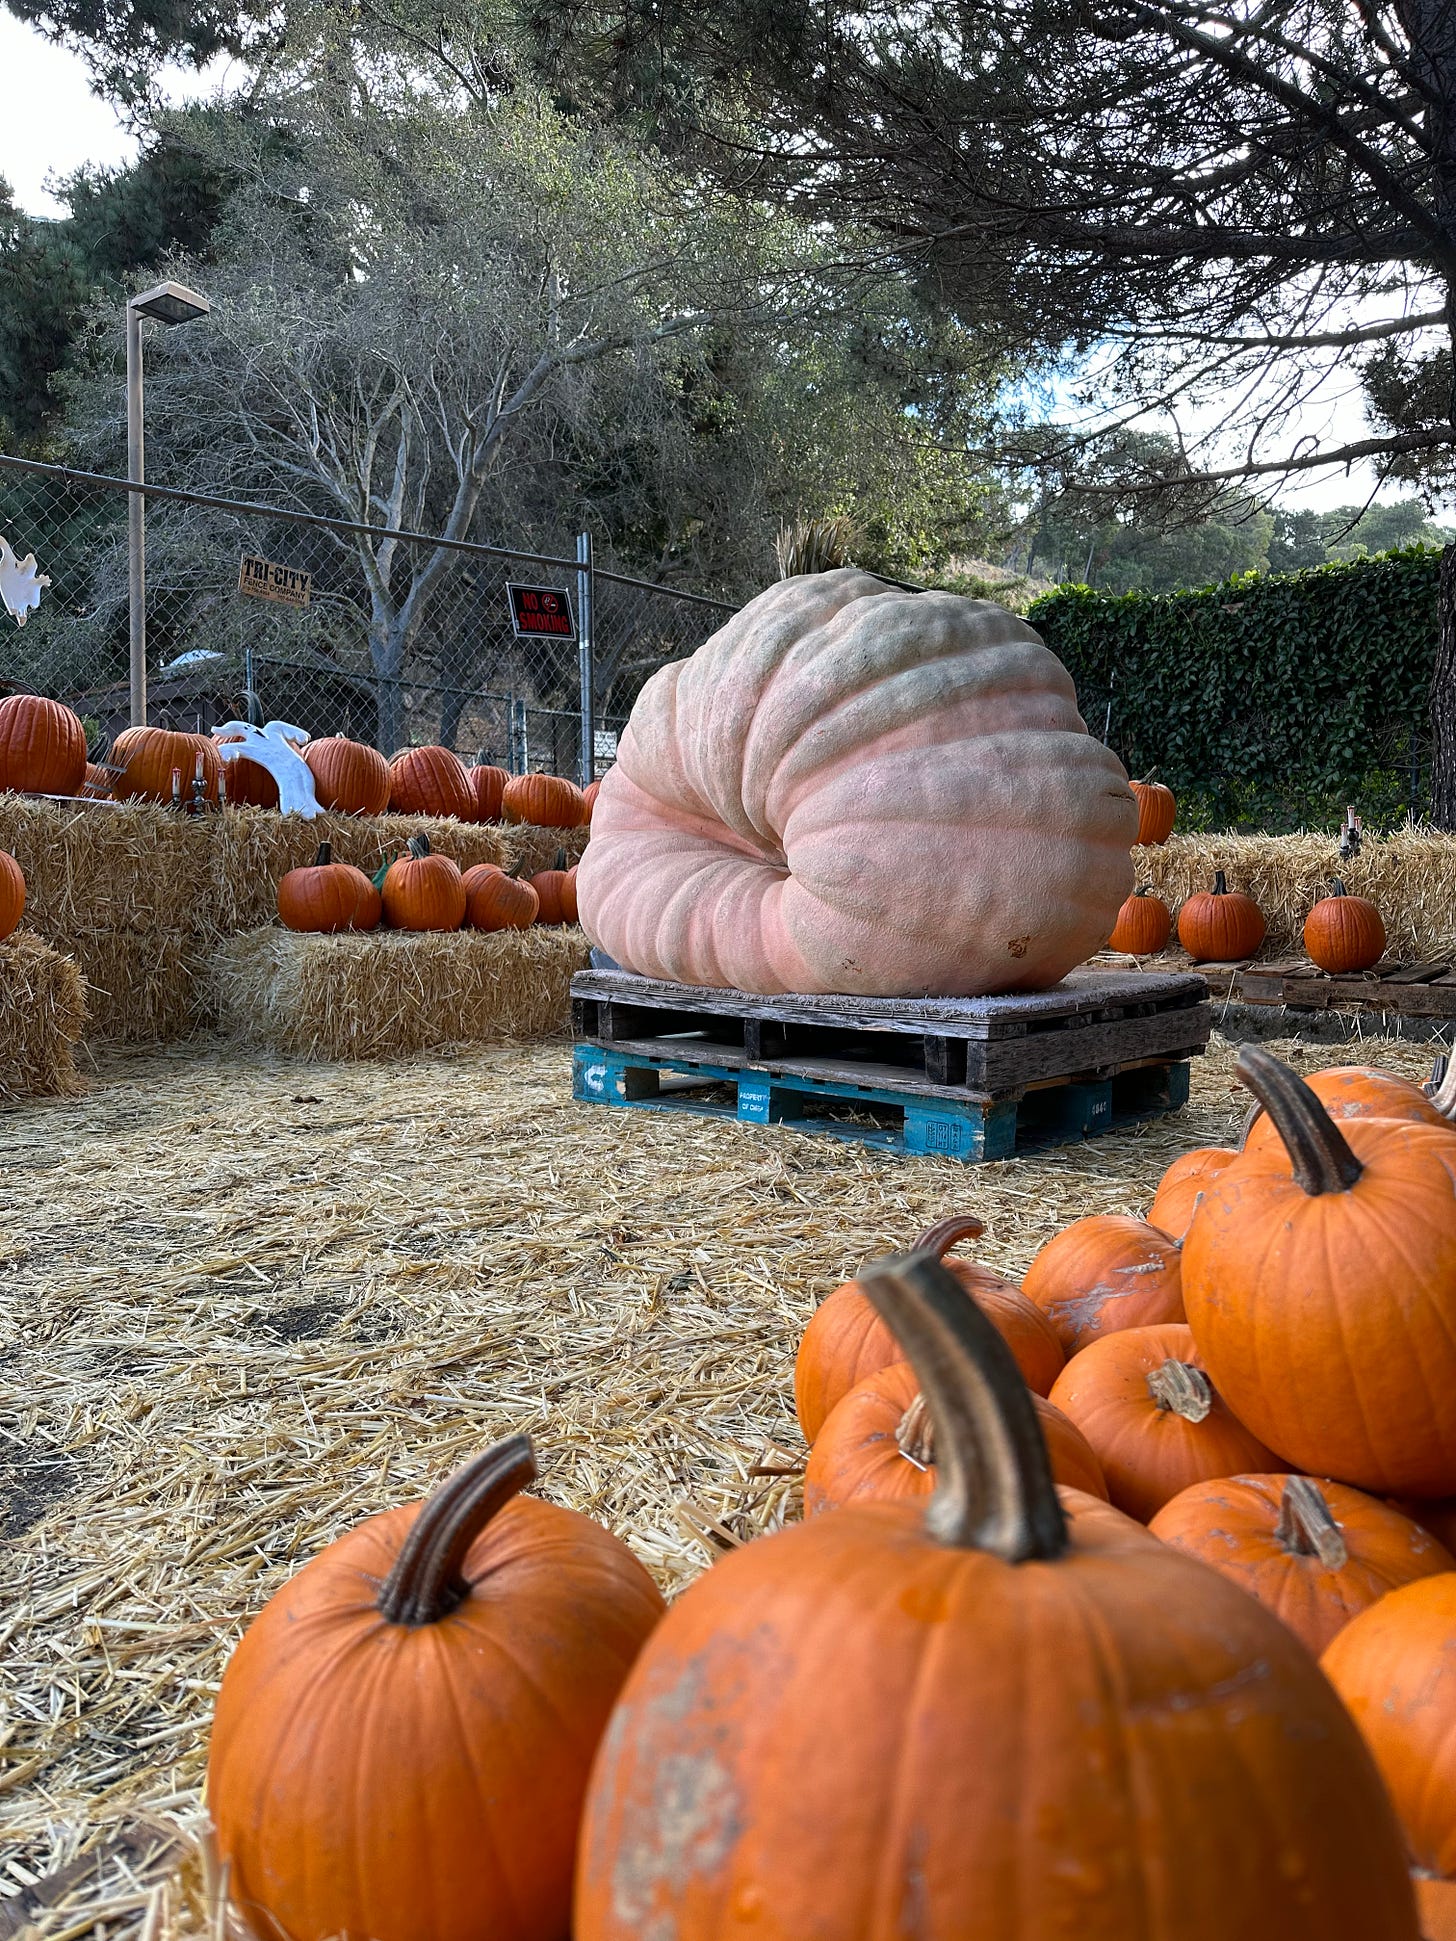
The best local signage was introducing a Giant Jack sign. Giant Jack is a massive pumpkin that we get every year and run a “guess the weight” contest. The winner gets the pumpkin delivered to their house for display on Halloween (and also removed, of course).
One interesting thing about our AOV this year is that it was ~$10 lower than 2022. We attribute this to more new customer demand from Google and a corresponding lower AOV from those customers. Orders were up 36% YoY, but AOV was down 18%.
Responding to Feedback
We asked for reviews with strategically placed flyers throughout the patch. We also asked as people were checking out and especially if they had heard about us through Google or Yelp.
One reviewer left this piece of feedback:
“Not many great photo backgrounds.”
This was an eye-opener for us and so we fixed it. By reorganizing some of the patch areas and setting up a display in front of the Giant Jack we were able to create several “instagrammable” moments at the patch and make it a much more photogenic destination. Kudos to Matt for identifying this opportunity.
Inventory Management
As I mentioned earlier the biggest cost to the patch and hit to our overall margin is inventory management. Because the patch has limited space (and pumpkins have a limited shelf-life) we don’t order everything we plan on selling up front. In order to closely manage our inventory we looked at sales patterns from prior years and went down another level to individual varietal sales. Because each transaction pulls from an item catalog we know which units are sold and when.
This wasn’t perfect this year (but much improved from years past). We likely could have sold an additional $2-4k of inventory but ran out of the most popular carving pumpkins at a few points in time. We did place a strategic order of carving pumpkins right before the last weekend which turned out to be a great call. That Saturday ended up being the best-sell
In case you’re curious, the best sellers are:
Carving pumpkins (small and large are most popular)
Cannon ball
Decorative gourds
Sugar pie
American tondo (also my favorite)
Wee-B-Little (probably due to price point of $2)
Strong execution made the final phase of the patch (liquidation) much, much easier.
Monetization Tradeoffs
It’s tough to measure this one, but specifically we made some tradeoffs that benefitted the experience but reduced potential revenue. For example, we introduced some carnival games this year and were originally charging for them. After a brief period we decided that wasn’t worth it.
Phase 3: Liquidation / Cleanup
We always close the patch on a weekend because that’s when we have the most volunteer availability. Turns out most people have to work during the week so it is harder to get them to show up for several hours.
In the liquidation and cleanup phase we try to sell every last pumpkin, hay bale, corn stalk, and basically anything that isn’t nailed down. In the past if we had to dispose of something (like soggy hay bales) we had to pay for the disposal. As you can imagine, this cuts into patch profitability. This year, there were a few things that the team did which made this phase a lot smoother.
First, we found homes for most of the hay bales in advance by pre-selling some of them to other organizations, creating a hay bale + pumpkin discount (buy a hay bale and get 50% off your basket), and finding groups who would take them as donations (like local pre-schools getting ready for their Halloween parade).
Second, we pre-negotiated removal and delivery of any excess pumpkins to the Oakland Zoo. They’re happy to take them because they use them to feed the animals. Turns out we didn’t actually need this though because we sold every last pumpkin in our inventory. We even got rid of a few smushed and starting-to-rot pumpkins that someone took to feed their worms.
Third, the reason we were able to sell every last pumpkin in inventory is because of both the inventory management mentioned above and some last minute/close-out promotion. We ran a discounting strategy for our last day that included bulk discounts of 20, 30 and 40% off your order based on purchase volume and buy one get a “little” for free.
In addition to that, all of the signage around town got a “close out sale” sign added to it to drive that last-minute urgency. We heard from a lot of people on Sunday that they had seen those signs and were motivated to come by. We were able to run this discounting strategy because we had a good sense of per unit margins so we knew exactly how much we could reduce by (if needed) and still not lose money. Much like a retailer at the end of the season it’s better to sell it than not.
All of this was organized in a day-by-day, hour-by-hour liquidation plan.
Conclusion and Lessons Learned
This was the most successful pumpkin patch year we’ve ever had and as a result of all of the above we grew customers by 35%, revenue by 12% and should grow profitability by more than 12% (still calculating!).
Since we always do a retrospective, here are a few things that we’ll take into next year:
Get the Giant Jack as early as possible and setup the photo stand early. This is a really big draw for the patch – no other local patch has one, the new signage worked well, and people love to take photos around it. The earlier we have it, the better. By the way, if you’re wondering… it clocked in at 1,036 lbs.
Manage inventory even more tightly. We did a fantastic job this year and still probably left $2-4k of sales on the table by not anticipating last-minute demand for carving pumpkins. Admittedly, the purchasing pattern this year was a little different than last year, probably because of the Google presence, so we’ll have to account for that in 2024. The Just-in-Time inventory management means we were able to sell a higher-quality product at all times with minimal waste.
Accessories sell well! We sold carving kits and “squirrel repellent” this year and both were very popular items. If we can figure out how to drive costs down on both of those they should be good additions in future years.
More photo ops. Rumor has it that we’re working on some painted, wooden cutouts for next year to make the patch even more photogenic. The experience that we offered with friendliness and the offer to take photos led to a good family dynamic at the patch.
Retention strategies. We collected some email addresses from Giant Jack guesses this year. We’ll have some people we can message heading into prime pumpkin season next year. Unfortunately, our Square account doesn’t allow for capturing all email information. Here’s hoping Square adds a small non-profit plan!
Train your volunteers. One area I overlooked in the planning and execution is that Matt created video walkthroughs of how to use all the technology at the patch. When you have 70+ volunteers this is very handy. The friendliness of volunteer labor – walking around the patch and offering to help people carry things, take pictures, and talk to them about their options made for a world of difference. Customers were so grateful to have this!
I hope you all can see that this isn’t just about a pumpkin patch. These strategies and lessons can help most any business; even ones at scale.
Happy Halloween!
The Wildwood Dads Club is a registered 501c3 nonprofit. If you were inspired by this newsletter and want to contribute to local schools you can make a donation to the club here. It’s for the kids!








Great post, Adam! Suggestion for acquisition strategy next year: perhaps try advertising on Nextdoor to Oakland and the greater Bay Area community. We ended up buying a grocery store pumpkin because we didn't know you existed. I am based in the East Bay and come to Oakland/Berkeley every weekend. Also, I am an easy upsell if you stock pumpkin carving and decoration kits!